Part 3: When do the goals come?
- Edwin Delgado

- Jun 13, 2018
- 3 min read
Updated: Feb 22, 2022
If you had the power to deduce when goals are going to happen, would you want to know? The timing of a goal depends on a vast range of factors, from strategy, positioning, talent and many others.
For this exercise, I decided to take the record of goals in the previous five world cups from France 1998 to Brazil 2014 to give you a little insight as to when during a match is the best time for a goal to be scored,on a purely statistical sense.
As the games are going to take place early in the morning, you may want to consider sleeping an extra hour and watching only one-half of some of the games, or maybe you're at work can only take a 1-hour break, so here is what the numbers say.
If you commit to watching only one half of a game, choose the second half. Through five World Cups, 244 goals have been scored in the first half and 363 in the second half, meaning percentage-wise, second halves on average see 48 percent more goals. In the bigger picture is about 40/60.
Now, with many having to work during the time the matches are taking place, you may want to know something at a more precise level to take your “Bathroom Break”
Here is what I did, I divided the game into six, 15-minute intervals to see what moments in the match tend to have the most goals.
Unsurprisingly, the first 15 minutes of a match tend to have fewer numbs. It’s completely normal, the first 10 to 15 minutes often serve as the study period used to know who the opponent is lining up before fully implementing your own strategy. opening minutes have 28 percent fewer goals than the average.
The numbers improve a bit in the next two 15 minute intervals, In the 240 matches that have been played in the group stage, there have been 85 goals scored from the 16th to 30th minute and 87the from the 31st minute to the half. Despite the increase that’s still 15 percent below average.
In the next two intervals (46th to 60th and 61st to 75th) 101 and 100 goals have been scored which is right at the average mark, but one of the main reasons the world cup is such a great event in which emotions can change in the blink of an eye is how often late goals come. 160 goals have been scored after the 75th minute. That's 60 percent above the average.
One of the things to note is that three of the last opening games have featured a goal in the first 15 minutes of the game.
In 1998 Brazil took an early lead against Scotland, in 2014 they scored an own goal 11 minutes into the game and the Germany- Costa Rica match in 2006 had two goals in the opening quarter hour.
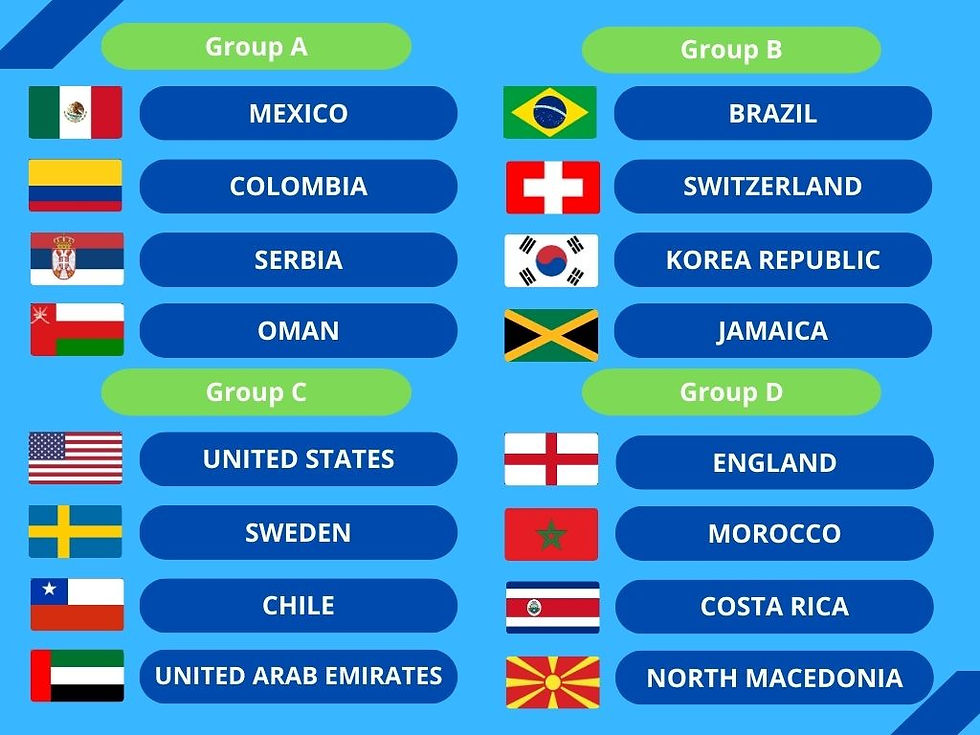
When dividing when goals happen for each group there are a few intriguing stats, for example, Group A has a high number of late goals scored in the first round of games with 13 goals scored after the 75th minute in 10 previous games.
Group B is has a high number of goals for all three rounds including 11 in the third round of games and group G has had 12 late goals in round 2, while goals are far more scarce in the other two rounds.
Here is the complete view:
Group A | 1-15 | 16-30 | 31-45+ | 46-60 | 61-75 | 76-FT | Total | 1H Total | 2H Total |
Matchday 1 | 4 | 5 | 3 | 3 | 6 | 13 | 34 | 12 | 22 |
Matchday 2 | 3 | 2 | 1 | 5 | 4 | 5 | 20 | 6 | 14 |
Matchday 3 | 1 | 8 | 6 | 4 | 6 | 8 | 33 | 15 | 18 |
Total | 8 | 15 | 10 | 12 | 10 | 26 | 87 | 33 | 54 |
Group B | 1-15 | 16-30 | 31-45+ | 46-60 | 61-75 | 76-FT | Total | 1H Total | 2H Total |
Matchday 1 | 6 | 1 | 5 | 5 | 3 | 8 | 28 | 12 | 16 |
Matchday 2 | 4 | 4 | 4 | 3 | 5 | 8 | 28 | 12 | 16 |
Matchday 3 | 2 | 2 | 6 | 6 | 4 | 11 | 31 | 10 | 31 |
Total | 12 | 7 | 15 | 14 | 12 | 27 | 87 | 34 | 53 |
Group C | 1-15 | 16-30 | 31-45+ | 46-60 | 61-75 | 76-FT | Total | 1H Total | 2H Total |
Matchday 1 | 2 | 3 | 4 | 3 | 5 | 6 | 23 | 9 | 14 |
Matchday 2 | 4 | 2 | 7 | 4 | 4 | 7 | 28 | 13 | 15 |
Matchday 3 | 6 | 4 | 7 | 3 | 5 | 7 | 32 | 17 | 15 |
Total | 12 | 9 | 18 | 10 | 14 | 20 | 83 | 39 | 44 |
Group D | 1-15 | 16-30 | 31-45+ | 46-60 | 61-75 | 76-FT | Total | 1H Total | 2H Total |
Matchday 1 | 3 | 7 | 3 | 5 | 4 | 5 | 27 | 13 | 14 |
Matchday 2 | 3 | 2 | 3 | 0 | 3 | 5 | 16 | 8 | 8 |
Matchday 3 | 6 | 3 | 0 | 5 | 5 | 7 | 26 | 9 | 17 |
Total | 12 | 12 | 6 | 10 | 12 | 17 | 69 | 30 | 39 |
Group E | 1-15 | 16-30 | 31-45+ | 46-60 | 61-75 | 76-FT | Total | 1H Total | 2H Total |
Matchday 1 | 1 | 4 | 7 | 5 | 4 | 7 | 29 | 12 | 16 |
Matchday 2 | 2 | 5 | 7 | 3 | 7 | 5 | 28 | 14 | 15 |
Matchday 3 | 4 | 5 | 3 | 1 | 4 | 6 | 23 | 12 | 11 |
Total | 7 | 14 | 17 | 9 | 15 | 18 | 80 | 38 | 42 |
Group F | 1-15 | 16-30 | 31-45+ | 46-60 | 61-75 | 76-FT | Total | 1H Total | 2H Total |
Matchday 1 | 1 | 2 | 1 | 2 | 5 | 5 | 16 | 4 | 12 |
Matchday 2 | 2 | 4 | 4 | 2 | 2 | 6 | 17 | 7 | 10 |
Matchday 3 | 4 | 2 | 4 | 9 | 1 | 7 | 27 | 10 | 17 |
Total | 7 | 8 | 9 | 13 | 8 | 18 | 60 | 21 | 39 |
Group G | 1-15 | 16-30 | 31-45+ | 46-60 | 61-75 | 76-FT | Total | 1H Total | 2H Total |
Matchday 1 | 3 | 1 | 5 | 3 | 2 | 5 | 19 | 9 | 10 |
Matchday 2 | 3 | 4 | 0 | 9 | 4 | 12 | 32 | 7 | 25 |
Matchday 3 | 2 | 5 | 1 | 4 | 2 | 4 | 18 | 8 | 10 |
Total | 8 | 10 | 6 | 16 | 8 | 21 | 69 | 24 | 45 |
Group H | 1-15 | 16-30 | 31-45+ | 46-60 | 61-75 | 76-FT | Total | 1H Total | 2H Total |
Matchday 1 | 1 | 5 | 2 | 7 | 7 | 4 | 26 | 8 | 18 |
Matchday 2 | 3 | 4 | 3 | 5 | 5 | 7 | 27 | 10 | 17 |
Matchday 3 | 2 | 1 | 4 | 5 | 3 | 4 | 19 | 7 | 12 |
Total | 6 | 10 | 9 | 17 | 15 | 15 | 72 | 25 | 47 |
| 1-15 | 16-30 | 31-45+ | 46-60 | 61-75 | 76-FT | Total | 1H Total | 2H Total |
GRAND TOTAL | 72 | 85 | 87 | 101 | 100 | 162 | 607 | 244 | 363 |
The dynamic for the Knockout Stage is just slightly different. The four 15-minute intervals that run from the 30th minute through the 75th minute of a game average about 4.4 to 5 goals per tournament, while the first 15 and last 15 minutes average 7.2 and 7.4 goals per tournament.
Extra-time goals were not factored into these numbers, in the last five tournaments a total of 18 goals have been scored in extra time with nearly half of them (8) scored in the 2014 World Cup in Brazil.

Comments